

Translation of a paper on high-resolution mapping of genotype-phenotype relationships in catless syndrome using array comparative genomic hybridization (Hiro Clinic NIPT tentative translation)
1 University of California, San Francisco Comprehensive Cancer Center and Department of Laboratory Medicine, 2 University of California, San Francisco Cancer Institute, 3 Institute of Human Genetics, Aarhus University (Aarhus, Denmark), 4 Institute of Medical Biochemistry and Genetics, University of Copenhagen (Copenhagen), 5 Beijing Genome Research, Chinese Academy of Sciences, Beijing Place
Introduction
Deletion of chromosome 5p results in a variety of developmental defects, and most cases are classified as missing cat syndrome (MIM 123450) (Niebuhr 1978a). These deletions can be terminal or interstitial and sometimes occur in the context of cytogenetically complex karyotypes (Sreekantaiah et al. 1999). There are several phenotypic components, including severe crying, facial dysmorphia, speech delay, and mental retardation (MR).
Several previous studies have shown an association between the extent of deleted segments on 5p and the phenotype (Overhauser et al. 1994; Church et al. 1997; Marinescu et al. 1999a; Mainardi et al. 2001). However, these studies have yielded somewhat inconsistent results and substance controversy regarding the relationship of MR to deleted regions. The divergent results may be due to inconsistent assessment of the phenotype by multiple observers, lack of consideration for the age dependence of the salience of some phenotypic traits, and limitations of the analytical techniques used to assess the genotype. likely due to a combination of factors (Wilkinset al. 1983; Church et al. 1995; Marinescu et al. 1999a; Johnson et al. 2000). This study addressed all of these potential issues.
Previous genotyping has used conventional cytogenetics, FISH, polymorphic markers, and more recently chromosome-based comparative genomic hybridization (CGH). (Marinescu et al. 1999b; Levy et al. 2002) Detect and define the nature of anomalies.
Traditional cytogenetic analysis provides an overview of the entire genome but has limited resolution. Therefore, aberration boundaries are inaccurately set, small deletions are missed, and complex abnormalities are inappropriately identified. FISH and polymorphic markers allow accurate assessment of aberrations and mapping of aberrations to genomic sequences, but require considerable effort as probes must be evaluated individually or in small groups. Therefore, the study of large numbers of loci and samples is very labor intensive. Although chromosomal CGH can screen the entire genome for DNA copy number changes in a single hybridization, its resolution is limited to approximately 5-10 Mb and the results cannot be mapped directly onto the genome sequence.
Recently, authors have developed methods to perform microarray CGH (Solinas-Toldo et al. 1997; Pinkel et al. 1998; Pollack et al. 1999; Snijders et al. 2001; Fiegler et al. 2003 ). Our array uses array elements made from large insertion genomic clones, such as BACS and PACS, and has a sufficient number of cells to allow reliable detection of single-copy aberrations affecting individual clones. Has measurement accuracy. The location of each clone on the genomic sequence is determined using sequence tags such as STS or terminal sequences. The resolution obtained with such arrays is determined by the genomic spacing between clones and clone length. Partial resolution of the BAC length can be obtained by using overlapping clones (Albertson et al. 2000).
In this study, array CGH was applied to the analysis of the genomic DNA of 94 patients determined to have deletions in 5p using conventional cytogenetics and FISH. These specimens were selected from a pool of 5p deletion cases that met our criteria and underwent detailed phenotypic evaluation prior to our analysis (Niebuhr 1978b; authors’ unpublished results). Evaluation was performed for most patients at several years of age to allow the phenotype to be established at the stage of development when it is best evaluated. A subset of these cases has been included in previous studies of the effects of 5p deletion and genotype-phenotype correlations (Overhauser et al. 1990, 1994; Church et al. 1995, 1997). Our results demonstrate the value of array CGH for the evaluation of these patients, allowing us to reveal and refine the genotype-phenotype correlations of MR, speech delay, facial dysmorphism, and characteristic crying in cat-less syndrome. I made it.
Method
Patients with catless syndrome
Subjects were selected from a group of over 150 5p deletion patients who have been extensively studied by one of us (E.N.) over the past several decades. Subjects were included if detailed clinical data and genomic DNA were available. To facilitate further research, the authors note that previous studies provided knowledge about the parental origin of somatic hybrids with abnormal chromosomes and abnormal chromosome 5, and familial genomic DNA was available. Only subjects were analyzed. Results of conventional cytogenetic analysis were available for most subjects. Table 1 lists 94 eligible subjects and includes phenotypic evaluation, conventional cytogenetic evaluation, and array results. Patient numbers 1-69 refer to consecutive Danish families (at time of diagnosis). More than 100 patients are from other countries: 100-117 patients from Norway, 201-256 patients from the United Kingdom, 300 patients from Czechoslovakia, and 402 patients from Australia. referred for more detailed clinical and cytogenetic evaluation. These cases are therefore a quasi-random sampling of individuals with the 5p deletion. Array CGH measurements of these specimens were performed after obtaining appropriate approval from the University of California, San Francisco Institutional Review Board.
Phenotypic characteristics were evaluated by a single observer (E.N.) and classification criteria were applied uniformly. Because phenotypic aspects can change during development, most patients were evaluated at <5 years of age and again at >5 years of age. The presence or absence of a phenotypic characteristic is labeled in Table 1 with a “Y” or “N”, respectively. Missing data is indicated by “ND” and phenotypic features may be age dependent, so if “Y” is present in subjects of any age group, the phenotype characteristics are classified as positive. For example, crying and facial dysmorphia were most prominent when patients were young, so the loss of these phenotypes in the elderly group was not considered significant. Some patients do not exhibit a particular phenotype in one age range (denoted by “N”), and for others data are not available, resulting in uncertainty in phenotypic status. Ta. Such cases were excluded from determining the relationship between their characteristics and genotype. Therefore, patients 18, 45, 56, 112, and 117 were not used to define cry regions, and patients 56 and 112 were not used to determine genomic regions associated with facial dysmorphia. Patients with the most severe mental disorders were not used to define speech delay areas because their speech ability may have been impaired for other reasons. Therefore, patient 45 was not used to localize the vocal component of the phenotype.
The psychomotor developmental assessment that defines the severity of MR was based on personal observation (E.N.), documentary information, psychological testing, and school performance information. Because MR is difficult to assess in young children, only patients with data over 5 years of age were used for correlation with deletion. Therefore, cases 22, 225, and 231 were excluded from this analysis. The degree of MR was indicated by a numerical scale ranging from 0 (not affected) to 7 (severely affected). General criteria for each classification are shown in Table 2. The uncertainties in these estimates are estimated to range from ±0.5 at the lower end of the scale to ±1.0 at the upper end.
The array for high-resolution analysis of Array-5p contained elements generated from BAC, P1, and PAC clones selected using genetically mapped STS markers (Hudson et al. 1995; Peterson et al. 1999), and a variable number of clones located on other chromosomes that were used for normalization and detection of other abnormalities. All clone locations are based on the July 2003 University of California Santa Cruz (UCSC) freeze of the human genome. The coverage density of 5p was highest in regions previously defined as important in cat-free syndrome. The 55 clones encompassing all of the 5p abnormalities observed in these patients are shown in Table 3. Once the genome sequence was completed, most clones could be precisely mapped. However, some sequence positions had to be interpolated based on genetic map information. All patients were analyzed on an array containing 55 clones on 5p and an additional 100-300 clones at other locations. Thirty-seven of the patients were analyzed on various versions of the array containing approximately 1,750-2,000 clones distributed throughout the genome (Snijders et al. 2001) to determine the presence of abnormalities involving other chromosomes. Some of these larger arrays did not contain the complete set of 5p clones.
DNA of array elements was isolated from clones and amplified by linker-adapter PCR. PCR products were suspended in 20% dimethyl sulfoxide in water at a concentration of approximately 0.8 μg/μl (Snijders et al. Spotted onto coated slides. For each clone, three adjacent spots were printed. For smaller arrays, two sets of triplicates were printed at widely separated locations on the array.
Array CGH Hybridization and Analysis -Total genomic DNA was isolated from peripheral blood of patient and control subjects using standard techniques, and DNA was labeled using either nick translation (1 μg) (Pinkel et al. 1998), or random primer extension (0.5 μg) (Snijders et al. 2001). For labeling, a fluorescent dye directly bound to dCTP was used. Some measurements used fluorescein and Texas Red (or Alexa 594), while other measurements used Cy3 and Cy5 to label the test and reference genomes, respectively.
Labeled test and reference genomic DNA, along with 50 μg of Cot-1 DNA included to suppress hybridization of repetitive sequences, was ethanol precipitated and resuspended in hybridization mix to a total volume of 50 μl. The final composition was 50% formamide/10% dextran sulfate/2# SSC/1%-4% (v/v) SDS.
The hybridization mixture was heated to 70°C to denature the DNA, and the temperature was lowered to 37°C for approximately 1 hour to allow reassociation of the repetitive sequences. For hybridization, a low barrier made of rubber cement was formed around the array. The hybridization mixture was then applied to the array and the array was placed in a sealed chamber with the top surface free of fluid. Hybridization proceeded for 16 to 48 h on a gently rocking table at 37°C (Pinkel et al. 1998).
After hybridization, the array was removed to remove most of the hybridization solution. , rapidly washed with a stream of PN buffer (0.1 M sodium phosphate; 0.1% Nonidet P40; pH 8), then immersed in 50% formamide/2# SSC for 15 min at 45 °C, then incubated with room temperature PN. A final wash for 15 minutes in buffer. After washing the arrays, apply 90% glycerol and 10% phosphate buffer, pH 9, containing 1 μM DNA stain DAPI (4′,6-diamidino-2-phenylindole) to each array and cover slip. added. DAPI stained the array spots and visualized them independently of the hybridization signal.
Arrays were imaged with a custom-built charge-coupled device (CCD) imaging system [Pinkel et al. 1998; authors’ unpublished data]. The entire array was contained within one CCD image. The image analysis software UCSF SPOT (Jain et al. 2002) was used for most analyses. This program used the DAPI image to determine the positions of the spots in the array and, after subtracting the local background, calculated the test and reference intensities for each pixel within each spot. The ratio of total test intensity (background subtracted) to total reference intensity (background subtracted) was used as an indicator of the relative copy number of each spot, and the ratios of replicates were averaged. No computational adjustments of any kind (shading correction, height normalization, spatially dependent normalization, and clone-specific normalization) were made to the images or ratio data. To recognize problem signals, a quality criterion was applied that included the correlation of test and reference signals within a spot. In general, spots with correlation r < 0.8 were rejected. Clones with SD >0.2 for replicates were removed from analysis. In most cases, the SD of replicate spots was <0.02. We also rejected clonal measurements using only one of the replicates that passed quality testing. A global normalization factor was applied and the median log2 ratio of 2 copies of array elements per cell, i.e. the median linear ratio, was set to 0 or 1, respectively.
Figure 1
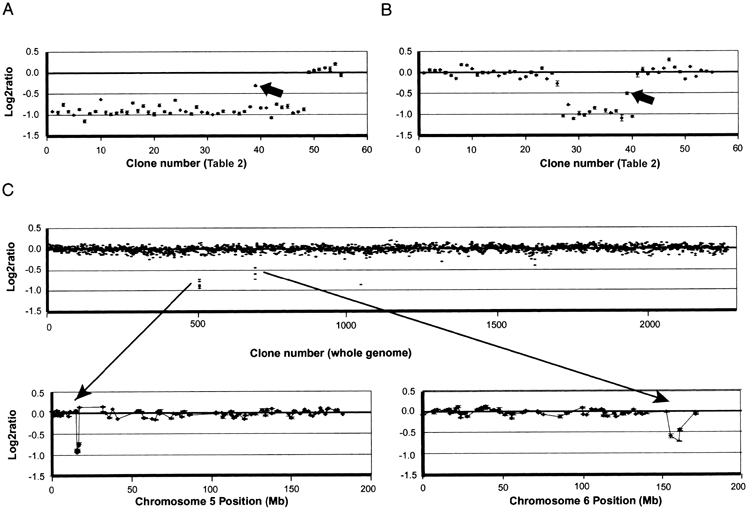
Table 1 Summary of main data of 94 patients with no-cat syndrome
| Patient | phenotype | Level | Conventional cytogeneticsa | Boundary (Mb/clone no.b) |
|||
|---|---|---|---|---|---|---|---|
| Characteristic cryc | Facial dysmorphiac | Audio delay | Proximald | Distal | |||
| 1 | Y/Y | Y/Y | Y | 5 | 46,XY,del(5)(p14.3)* | 20.837/39 | |
| 3 | Y/Y | Y/Y | Y | 6.5 | 46,XY,del(5)(p13.3)* | 30.726/51 | |
| 4 | Y/Y | Y/Y | Y | 6 | 46,XY,der(5)t(5;22)(p14.2;p13)pat | 30.022/44 | |
| 5 | Y/Y | Y/Y | Y | 5.5 | 46,XY,del(5)(p14.3)* | 17.500/37 | |
| 6 | Y/Y | Y/Y | Y | 6 | 46,XX,del(5)(p14.1)* | 23.276/41 | |
| 8 | Y/Y | Y/Y | Y | 6 | 46,XY,del(5)(p14.1)* | 25.841/42 | |
| 9 | Y/Y | Y/Y | Y | 7 | 45,XX,dic(5;13)(p13.3;p12)* | 31.942/45 | |
| 10 | Y/Y | Y/Y | Y | 5.5 | 46,XX,del(5)(p14.2)* | 21.797/40 | |
| 11 | ND/Y | Y/Y | Y | 5.5 | 46,XX,del(5)(p14.1)* | 30.022/44 | |
| 12 | ND/Y | Y/Y | Y | 5.5 | 46,XX,del(5)(p14.3)* | 18.336/38 | |
| 13 | Y/Y | Y/Y | Y | 6 | 46,XX,del(5)(p13.3)* | 33.428/49 | |
| 14 | Y/Y | Y/Y | Y | 6 | 46,XY,del(5)(p13.3)* | 30.022/44 | |
| 15 | Y/Y | Y/Y | Y | 5 | 46,XX,del(5)(p14.3)* | 20.837/39 | |
| 16 | Y/Y | Y/N | Y | 6.5 | 46,XX,der(5)t(5;8)(p14.1;p22)* | 31.751/46 | |
| 17 | Y/Y | Y/Y | Y | 6 | 46,XX,del(5)(p14.1)* | 25.841/42 | |
| 18 | ND/N | Y/N | N | 6 | 46,XY,del(5)(p14.1p15.31)*IN | 30.022/44 | 8.021/15 |
| 20 | Y/Y | Y/Y | Y | 6 | 46,XX,del(5)(p14.1)* | 31.751/46 | |
| 21 | Y/Y | Y/Y | Y | 5.5 | 46,XX,del(5)(p14.3)* | 18.336/38 | |
| 22 | Y/ND | Y/ND | Y | NAe | 46,XX,add(5)(p14.3)* | 21.797/40 | |
| 23 | Y/Y | Y/Y | Y | 6 | 46,XY,del(5)(p14.1)* | 30.022/44 | |
| 24 | Y/Y | Y/N | Y | 7 | 46,XX,add(5)(p14.1)mat | 21.797/40 | |
| 25 | Y/Y | Y/N | Y | 7 | 46,XX,add(5)(p14.2)* | 18.336/38 | |
| 26 | Y/Y | Y/Y | Y | 6 | 46,XY,del(5)(p14.1)* | 31.751/46 | |
| 27 | Y/Y | Y/Y | Y | 6 | 46,XY,del(5)(p13.3)* | 33.428/49 | |
| 28 | Y/Y | Y/Y | Y | 5 | 46,XX,del(5)(p14.3)* | 20.837/39 | |
| 30 | Y/Y | Y/Y | Y | 5.5 | 46,XX,del(5)(p14.3)* | 20.837/39 | |
| 31 | Y/Y | Y/Y | Y | 6 | 46,XX,del(5)(p13.3)* | 31.942/45 | |
| 35 | Y/ND | Y/ND | Y | 6.5 | 45,XY,der(5)t(5;14)(p14.2;q12),-14,mat | 23.276/41 | |
| 36 | Y/Y | Y/Y | Y | 6 | 46,XX,del(5)(p14.1)* | 30.022/44 | |
| 37 | Y/Y | Y/Y | Y | 6 | 46,XX,del(5)(p14.1)* | 30.022/44 | |
| 38 | Y/Y | Y/Y | Y | 5 | 46,XX,del(5)(p15.1)* | 18.336/38 | |
| 39 | Y/Y | Y/Y | Y | 6 | 46,XX,del(5)(p14.1)* | 30.022/44 | |
| 40 | Y/Y | Y/Y | Y | 5 | 46,XY,del(5)(p15.1)* | 16.684/33 | |
| 42 | Y/Y | Y/ND | Y | 3 | 46,XX,del(5)(p15.2)* | 11.035/28 | |
| 44 | Y/Y | Y/ND | Y | 3 | 46,XX,del(5)(p15.2)* | 11.035/28 | 1.207/1 |
| 45 | ND/N | N/N | Y | 7 | 46,XY,der(14)t(5;14)(q11;p13) del(5)(p14.3p15.31)* | 17.500/37 | 14.929/30 |
| 48 | Y/N | Y/N | Y | 6.5 | 46,XY,add(5)(p14.2)* | 16.684/33 | |
| 49 | Y/Y | Y/Y | N | 5 | 46,XX,der(5) ins(15;5)(q22;p14.3p15.31)mat | 26.794/43 | 5.945/12 |
| 50 | Y/Y | Y/Y | Y | 6 | 46,XX,del(5)(p14.1)* | 31.942/45 | |
| 51 | N/N | N/N | N | 0 | 46,XX,del(5)(p13.3p14.1)mat | 31.942/45 | 18.336/38 |
| 52 | Y/Y | Y/Y | Y | 6.5 | 46,XY,del(5)(p13.3)* | 31.751/46 | |
| 54 | Y/Y | Y/Y | Y | 5 | 46,XX,del(5)(p15.1)* | 16.684/33 | |
| 55 | Y/Y | Y/Y | Y | 5.5 | 46,XX,der(5)t(5;13)(p14.3;p12)mat | 20.837/39 | |
| 56 | ND/N | ND/N | ND | 6 | 46,XY,der(5)t(5;7)(p14.1p21)? del(5)(p14.1p15.1)?del(7)* | 26.794/43 | 8.021/15 |
| 58 | Y/Y | Y/Y | Y | 6 | 46,XX,del(5)(p14.1)* | 30.022/44 | |
| 59 | Y/Y | Y/Y | Y | 5 | 46,XX,del(5)(p14.3)* | 23.276/41 | |
| 60 | Y/Y | Y/Y | Y | 5 | 46,XY,del(5)(p14.2)* | 20.837/39 | |
| 63 | Y/Y | Y/Y | Y | 5 | 46,XX,rec(5)del(5)(p14.2) inv(5)(p14.1p15.1)mat | 21.797/40 | |
| 66 | Y/Y | Y/Y | Y | 6 | 46,XX,del(5)(p14.2)* | 23.276/41 | |
| 68 | Y/Y | Y/Y | Y | 6 | 46,XY,del(5)(p14.1)* | 25.841/42 | |
| 101 | Y/Y | Y/ND | Y | 2.5 | 46,XX,del(5)(p15.2)* | 11.035/28 | |
| 102 | Y/Y | Y/Y | Y | 5 | 46,XX,del(5)(p14.2p15.33)* | 23.276/41 | 3.174/4 |
| 104 | Y/Y | Y/Y | Y | 6.5 | 46,XY,del(5)(p13.3)* | 32.162/48 | |
| 105 | Y/Y | Y/Y | Y | 5 | 46,XX,del(5)(p14.3)* | 17.224/36 | |
| 107 | Y/Y | Y/Y | Y | 6 | 46,XY,del(5)(p13.3)* | 33.428/49 | |
| 109 | Y/Y | Y/Y | Y | 5.5 | mos 46,XX,del(5)(p14.1)/del(5)(p15.2)* | 25.841/42 | |
| 110 | Y/Y | Y/Y | Y | 6.5 | 46,XX,del(5)(p13.3)* | 30.726/51 | |
| 111 | Y/Y | Y/Y | Y | 6 | 46,XY,del(5)(p14.1)* | 25.841/42 | |
| 112 | ND/N | ND/N | N | 1 | 46,XX,del(5)(p14.2p15.2)* | 23.276/41 | 11.435/27 |
| 113 | Y/Y | Y/Y | Y | 5 | 46,XX,del(5)(p14.1)* | 23.276/41 | |
| 114 | N/N | N/N | N | 2 | 46,XY,del(5)(p14.2p15.2)* | 23.276/41 | 11.360/26 |
| 115 | Y/Y | Y/Y | Y | 5 | 46,XX,del(5)(p15.2)* | 11.035/28 | |
| 117 | ND/N | N/N | Y | 3.5 | 46,XY,del(5)(p15.31)* | 9.288/18 | |
| 201 | Y/Y | Y/N | Y | 7 | 46,XY,add(5)(p14.3)* | 17.224/36 | |
| 202 | Y/Y | Y/ND | Y | 2.5 | 46,XY,del(5)(p15.2)* | 11.435/27 | |
| 203 | Y/Y | Y/Y | Y | 6 | 46,XY,del(5)(p13.3)* | 30.022/44 | |
| 205 | Y/Y | Y/Y | Y | 5 | 46,XY,del(5)(p14.2)* | 21.797/40 | |
| 206 | Y/Y | Y/ND | Y | 7 | 46,XX,add(5)(p14.3)pat | 18.336/38 | |
| 209 | Y/Y | Y/Y | Y | 6 | 46,XX,del(5)(p13.3)* | 31.751/46 | |
| 210 | Y/Y | Y/Y | Y | 7 | 46,XX,del(5)(p14.1)pat | 25.841/42 | |
| 212 | Y/Y | Y/Y | Y | 6.5 | 46,XY,del(5)(p14.1)* | 30.022/44 | |
| 213 | Y/Y | Y/Y | Y | 5 | 46,XX,del(5)(p14.2)* | 20.837/39 | |
| 214 | Y/Y | Y/Y | Y | 5 | 46,XX,del(5)(p14.2)* | 17.224/36 | |
| 215 | Y/Y | Y/N | Y | 7 | 46,XX,der(5)t(4;5)(q32;p14.3)* | 14.929/30 | |
| 216 | Y/Y | Y/Y | Y | 5 | 46,XX,del(5)(p14.2)* | 20.837/39 | |
| 218 | Y/Y | Y/Y | Y | 6.5 | 46,XX,add(5)(p14.3)pat | 17.500/37f | |
| 219 | Y/Y | Y/Y | Y | 6.5 | 46,XY,del(5)(p14.1)* | 25.841/42 | 1.207/1 |
| 221 | Y/Y | Y/Y | Y | 5 | 46,XX,del(5)(p14.2)* | 18.336/38 | |
| 222 | Y/Y | Y/Y | Y | 6 | 46,XY,del(5)(p14.1)* | 26.794/43 | |
| 223 | Y/Y | Y/Y | Y | 6 | 46,XX,del(5)(p13.3)* | 33.428/49 | |
| 225 | Y/ND | Y/ND | Y | 4g | 46,XY,del(5)(p14.3p15.31)* | 21.797/40 3.174/4 | |
| 228 | Y/Y | Y/Y | Y | 6 | 46,XY,add(5)(p15.2)pat | 11.035/28 | |
| 229 | Y/Y | Y/Y | Y | 7 | 45,XX,dic(5;22)(p13.2 p12)* | 33.428/49 | |
| 231 | Y/ND | Y/ND | Y | 3.5g | 46,XX,del(5)(p15.1)* | 15.679/31 | |
| 232 | Y/Y | Y/Y | Y | 6.5 | 46,XX,del(5)(p13.3)* | 31.942/45 | |
| 250 | Y/Y | Y/Y | Y | 5 | 46,XX,del(5)(p14.1)* | 26.794/43 | |
| 251 | Y/Y | Y/Y | Y | 6.5 | 46,XX,del(5)(p13.3)* | 30.022/44 | |
| 252 | N/N | N/N | N | 5 | 46,XY,del(5)(p15.1p15.31)* | 15.872/32 | 6.365/13 |
| 253 | Y/Y | Y/Y | Y | 5 | 46,XY,r(5)(14.3q35.3)* | 20.837/39 | |
| 254 | Y/Y | Y/Y | Y | 5 | 46,XY,del(5)(p14.3)* | 20.837/39 | |
| 255 | Y/Y | Y/Y | Y | 6.5 | 46,XY,add(5)(p14.2)* | 20.837/39 | |
| 256 | Y/Y | Y/Y | Y | 5.5 | 46,XX,del(5)(p13.3)* | 30.022/44 | |
| 300 | Y/Y | Y/Y | Y | 5 | 46,XY,del(5)(p14.1)* | 25.841/42 | |
| 402 | Y/Y | Y/ND | Y | 3 | 46,XY,del(5)(p15.2)* | 11.035/28 | |
Result
Array CGH measurement
Representative copy number profiles of chromosome 5 and whole genome scans are shown in Figure 1. The gains in single copy deletion and homogeneous samples would ideally have log2 ratios of -1.0 and +0.58, respectively.
In practice, deletion ratios range from -1 to -0.7, likely due to incomplete suppression of signal from highly repeated sequences, cross-hybridization, and incomplete definition of background levels. Due to such reasons, there was a deviation from the ideal. This almost quantitative relationship between the ratio to copy number and the noise level (shown in Figure 1) makes it possible to simply set the log2 ratio equal to -0.4. By using a threshold value, we were able to detect deletions with very high confidence. In most cases, sufficient precision was achieved in a single hybridization to establish deletion boundaries for one or both of the intervals between two array clones. If the first measurement was too noisy to identify clones adjacent to the deletion boundary, measurements were repeated. Measurements by dye reversal were not performed as they did not provide any more information than rehybridization. Sometimes, repurification of specimen DNA is found to improve the quality of the data, indicating that unknown contaminants in some specimens affect the ability to consistently label or hybridize genomic DNA. Ta.
Table 1 summarizes deletion data, conventional cytogenetic analysis, and phenotypic characteristics for 94 patients. Patients are listed in numerical order, corresponding to previous numbering (Niebuhr 1978a; authors’ unpublished material).
The deletions in 82 subjects were terminal, whereas in 12 the deletions were interstitial, with a total of 106 borderline deletions at 5p. As detailed below, 15 of the subjects had copy number abnormalities in addition to the 5p deletion. Three of these aberrations were duplications of the 5p sequence adjacent to the deletion boundary, while the other aberrations were located in the genome other than 5p, as shown in Table 4. contained the area.
Based on the authors’ measurements, two indications of interesting DNA sequence features were found. First, significant breakpoint clusters were detected. All 106 deletion boundaries observed in these patients occurred within approximately 33 Mb of the distal chromosome, resulting in an average density of approximately 3 boundaries per megabase. Of the 94 cases, 9 had distal or proximal boundaries in the approximately 0.5 Mb region of clones 26, 27, and 28 of 5p15.2, resulting in approximately 18 boundaries per megabase. Furthermore, when the clones in this region are ordered as shown in the July 2003 sequence freeze, the deletion boundaries appear complex, with oscillations in the proportion of clones flanking the boundaries. Reordering the clones simplifies the apparent structure of the deletion boundary in all cases. Table 3 lists the clones in the revised order, but indicates the position of the base sequences based on the collection of genome sequences. These results suggest that several sequence motifs may exist in this region that promote aberrant formation and complicate proper assembly of genomic sequences. Alternatively, if the sequence assembly is correct, clusters at the deletion border of this region have a repeating complex copy structure that reflects local sequence features. A higher density of clonal coverage would potentially narrow the size of this cluster region and potentially reveal other breakpoint clusters in 5p. The second sequence feature we discovered was a region of sequence duplication on 5p in the normal human genome. The data for 58 cases (e.g., Figures 1A and 1B) show that clone 39 is in the normal region when surrounding clones are clearly deleted. It was shown to have a log2 ratio ~
-0.4, which is intermediate between that and deletion. However, when the deletion was extended proximally to include the region of clones 51 and 52, the ratio on clone 39 was reduced to the expected value. This suggests that a significant portion of clone 39’s sequence was duplicated on 5p between clones 51 and 52, and the deletion involving only clone 39 was 4 copies to 3 copies (log2 [3/4] ~-0.4). FISH analysis using this BAC as a probe confirmed this hypothesis and found two closely located signals at 5p. Freezing of parts of the human genome sequence (June 2002, November 2002, April 2003) showed the existence of this duplication, with markers in this BAC of 20.791 Mb and 34.070 Mb (April 2003). It was shown that it is located in both.
The July 2003 freeze does not indicate duplication. Large duplications of this type occur frequently in genomes (Lupski et al. 1996; Eichler 2001).No polymorphisms were observed in DNA copy number (Albertson and Pinkel 2003; Iafrate et al. 2004; Sebat et al. al. 2004) samples containing clone 39 were found in this set. A further indication of possible sequence complexity in this region is that the sequence set is close to our deletion boundary near clone 51, as described in Table 3. The fact is that it does not match the order of clones indicated by the simplest interpretation of .
Dependency of MR on deletion
Figure 2A shows the relationship between 5p deletion and patient MR status, with patients ordered by increasing levels of delay. There is. This relationship appears complex and somewhat perplexing. Although the severity of delay clearly increases as the degree of deletion increases, there are some important exceptions. For example, some patients with interstitial deletions in 5p may be unaffected or only slightly delayed, whereas patients with small deletions in the same region may be significantly delayed. Some patients do.
Conventional cytogenetic and FISH analyzes have been previously performed on these subjects, indicating that the chromosomal abnormalities in some patients are complex and involve chromosomal rearrangements in addition to chromosome 5. It was shown to be possible. Therefore, 37 patients were analyzed using an array that provides genome-wide data. These cases were all cases in which the 5p deletion appeared to be too small to explain the level of delay when compared to the general trend, plus about the same number that fit the trend. Both subjects with severe delays and minor 5p deletions had additional gains and losses (e.g., patient 45 [shown in Figure 1C ]).
No specific phenotypic effects were specifically attributable to any of these additional abnormalities. Details of subjects with abnormalities are shown in Table 4. Because these measurements used arrays with evolving clonal compositions, the precision with which the boundaries of additional aberrations are defined is variable. However, it is clear that these aberrations typically involve at least some contiguous sequence elements and are considerably larger than copy number variations in unaffected individuals (Albertson and Pinkel 2003; Iafrate et al. 2004; Sebatet al. 2004).
Some of these complex cases involve additional abnormalities affecting chromosome 5, including some duplicated material proximal to the deletion border. include. Figure 2B shows the relationship between deletion and MR level for all patients with a 5p deletion and no other abnormalities detected. The relationship between MR severity and deletion size and location is now much more consistent.
Chromosomal region that affects crying, delayed speech, and facial abnormalities
Chromosome regions that influence crying, vocalizations, and facial features have previously been mapped to the distal portion of 5p (Overhauser et al. 1994; Gersh et al. 1995, 1997).
Figure 3 shows data for subjects with deletion boundaries that provide information about these genotype-phenotype relationships. For each case, the bordering clones are shown. The region contributing to the characteristic cry is most narrowly defined by differences in patients 49 and 252, both of whom have interstitial defects. For patient 49 with cry, the deletion begins proximal to clone 12, and for patient 252 without cry, the deletion may retain sequences up to clone 14. Thus, the chromosomal region responsible for this phenotype is located in a 1.5 Mb region between these clones.
The regions affecting distinctive facial features are most narrowly defined by patients 117, 202, and 114. Patient 117 has a terminal deletion starting between clones 17 and 18 and has no facial phenotype. Therefore, the critical region must be located proximal to clone 17. This is because the material can be held up to this position. Patient 202 has a larger terminal deletion, borders between clones 26 and 27, and has a phenotype. This defines the 2.4-Mb region between clones 17 and 27 as the region responsible for facial features. Patient 114 supports the proximal limit of this region. Patient 114 has an interstitial deletion with a distal border between clones 26 and 27 and no phenotype, placing the significant location of this phenotype distal to clone 27. We note that patient 252 with a deletion involving this proposed critical region is a discordant because the patient does not have the phenotype.
The chromosomal regions involved in speech delay are best defined by data from patients 102, 225, and 49 with interstitial deletions. In patients 102 and 225 with the phenotype, the deletion is proximal to clone 4. In patient 49, who has no phenotype, the distal portion of the chromosome can be retained up to clone 13. Therefore, the speech delay is due to a deletion within the 3.2-Mb region between clones 4 and 13.
Consideration
Establishing the relationship between patient genotype and phenotype in an emerging syndrome is the first step toward discovering the genetic mechanisms responsible for the symptoms and provides the basis for clinical management of the disease in patients. do. A number of previous studies on the chromosomal abnormalities that cause catless syndrome have established the outline of this relationship, as summarized in Figure 4. Several regions on chromosome 5p have been defined that differentially influence different components of the classical phenotype, and one, 5p15.2, has a strong effect on MR and is referred to as the “cri du chat critical region” (CdCCR). others are associated with characteristic crying, language delay, and facial features. However, there were significant differences between the various studies, including the discussion of the relationship between MR and deletions. This study, which used array CGH to perform efficient high-resolution analysis of DNA copy number changes in a carefully phenotypically assessed patient population, provides more precise information on specific aspects of the phenotype and supports the discussion. clarified some of the issues with room for improvement.
The relationship between deletion size and MR is difficult to confirm, and some studies have revealed that the severity of the effect increases progressively as deletion size increases. In our study, our measurements (Niebuhr 1978a, 1978b; Overhauser et al.) analyzed a series of patients whose MR status was assessed on a numerical scale in a consistent manner by a single observer (E.N.) many years ago. 1990, Kjaer and Niebuhr 1999.
Assessment of delay. We included only patients whose evaluation was performed if they were 5 years of age or older, as this may depend on the patient’s age. All analyzes were performed using peripheral blood rather than Epstein-Barr virus-transformed cell lines. Because we used isolated DNA, transformation-induced abnormalities did not confound our results.
Figure 2A shows the relationship between 5p deletion and MR level. Although it is clear that patients with MR levels up to about 3 have smaller deletions than those with MR levels 5 and above, the dependence of delay on deletion size appears to be weak. For example, at MR level 5 and above, there is almost complete overlap in deletion extent between different delay levels, so that many patients with level -5 MR have a similar 5p level as those with level -7 MR. Has a deletion. Additionally, there are some notable discrepancies. Patients 112 and 114 have approximately 10 Mb of interstitial deletions with MR levels of 1-2, while markedly affected patient 45 has a much smaller interstitial deletion in the same region.
Cytogenetic analyzes have previously shown that some patients with catless syndrome have complex chromosomal rearrangements with copy number abnormalities that involve other regions of the genome. Therefore, the authors performed whole-genome array CGH on 37 patients, all of whom had 5p deletions that appeared to be too small to explain the level of delay. As shown in Table 4, 15 of these patients had abnormalities in addition to the 5p deletion. Our results showed that the majority of severely retarded subjects (14/22) had abnormalities in addition to the 5p deletion. The dependence of the delay on the size and location of the deletion becomes much clearer when we focus our attention on subjects whose only abnormality we detected was a 5p deletion. Figure 2B shows that for delay levels 3.5 and above, delay increases monotonically as deletion size increases. Slight deviations from this general behavior may be due to modifications in patient genetic factors, uncertainty in determining MR levels, or small abnormalities that were not detected elsewhere in the genome. Note that the clear relationship between MR and deletions, as shown in Figure 2B, supports the accuracy of patient phenotypic assessment. do. This is because the possibility of MR occurring by chance is extremely low. The absence of patients with deletion borders more proximal to 5pter to 33 Mb may indicate that such deletions are lethal during development.
Array CGH provides a more complete assessment of the genome than standard cytogenetics. Overall, approximately 16% of subjects had complex abnormalities, which was slightly higher than the 12% to 13% in previous studies (Niebuhr 1978a; Mainardi et al.). 2001).
Many (but not all) subjects with new dose abnormalities on array CGH (e.g. patient 206) had cytogenetically detected cases involving chromosome 5 and other chromosomes. Structural abnormalities were observed (Table 1). Conversely, some subjects with interchromosomal cytogenetic abnormalities (e.g., patients 4 and 49) had no copy number changes other than chromosome 5p. Therefore, the higher resolution and efficiency of array CGH should have important advantages in the assessment of dose abnormalities in cat-free syndrome and have significant diagnostic advantages, especially for severely delayed patients. Approximately two-thirds of them have moderate 5p deletions and additional abnormalities.
As shown in Figure 2B, there are three chromosomal regions that differentially affect this phenotype, as MR is dependent on the 5p deletion. It is suggested that Initial MRI was included in all patients with deletions at delay level 2.5 or higher. Findings in patients 117 and 56 indicate that MRI may be localized to a 1.2-Mb region between clones 15 and 18 of 5p15.31, which has been defined in other publications. at the end of the CdCCR at 5p15.2 (Overhauser et al. 1994; Mainardi et al. 2001).
It is unclear how many important genes are included in MRI, but their size The fact that the numbers are limited suggests that there may be a very small number of them.
Two other regions, MRII and MRIII, are located immediately proximal to the MRI, as shown in Figure 2B. Deletions restricted to MRII have a mild effect, whereas deletions affecting only MRIII (eg, patient 51) do not result in a discernible phenotype. However, patients with deletions involving MRI have progressively more severe delays as the deletion extends to MRII and MRIII. Thus, a set of genes within MRII and MRIII appear to contribute to the phenotype, perhaps through modifying the effects of genes on MRI.
The definition of these boundaries is, of course, subject to some uncertainty and depends on the underlying model adopted for how deletions affect MR. Our model essentially assigns a dominant role to MRI, and further abnormalities in MRII and MRIII serve to dramatically increase the severity of the phenotype. The distal boundary of MRI is set by the fact that deletion or retention of genes distal to clone 15 does not significantly affect MR levels in our patients. However, there are no patients in our set with deletions localized to the distal region on MRI and cannot be absolutely confirmed. Although the absence of a deletion may indicate a lack of confirmation due to the lack of an MR phenotype, one would expect such individuals to have other features of no-cat syndrome.
Setting the proximal boundaries of MRI is more problematic.
So far, we have demonstrated the selection of the smallest possible region that matches the data using patient 117 boundaries. However, in other subjects with less severe, more severe levels of delay, a slightly larger deletion is observed, bordering the breakpoint cluster region near clones 26-28. Therefore, patient 117 is somewhat abnormal, so the MRI can be extended an additional 2 Mb distally to clone 28. Analysis of a large number of additional cases with well-characterized phenotypes will be required to more clearly define this region.
Deletions restricted to MRII and MRIII result in mildly affected or phenotypically normal individuals. However, the relatively normal phenotype appears to be ‘fragile’. This is because other abnormalities result in severe phenotypes.
These additional abnormalities include MRI deletions as mentioned above, and/or chromosome 5 (as in patients 25, 48, 104, 201, and 251) or other chromosomes (Table 4) Includes increases and decreases in other areas above.
For example, patient 45, who was severely delayed, had only a small deletion within MRII at 5p, which would be expected to result in a very mild delay. Thus, additional deletion of 6q (Figure 1C) likely results in a very severe MR phenotype. We note that increases in MRII and MRIII may affect the phenotype. Patient 48 with MR level 6.5 has a partial deletion of MRII and MRIII consistent with delay level 4-5. Thus, duplication of a portion of MRII and MRIII (at the deletion border) has a strong effect.
The normal phenotypic vulnerability in individuals with MRIII deletions is also indicated by pedigree data. For example, the deletion in patient 51 is present in the mother and grandparents, and all three are unaffected. However, there are reports that unaffected parents with an MRIII deletion may have an affected child who has inherited the deletion (Hand et al. 2000, Johnson et al. 2000).
This phenotypic change may indicate that environmental or genetic modifiers that do not have deleterious effects in people with normal genomes have serious consequences in people with MRIII deletions. There is sex. Alternatively, affected children may have additional abnormalities that were not detected by the techniques used in these studies. High-resolution whole-genome array CGH may detect such abnormalities and reveal the genotypic status of these children.
The authors’ measurements also provided improved localization of regions on chromosome 5p that influence characteristic crying, facial features, and speech delay. In the cry region, deletions in only one clone differentiated patients with and without the phenotype. This places potentially important genes on the array between the two flanking clones (containing markers D5S2054 and D5S676, respectively). Therefore, high-resolution analysis of these two cases would allow placing tighter limits in the critical region. High error resolution analysis of the current case would not substantially refine speech delays or facial regions since multiple array clones are included among them. Figure 4 shows a comparison of our results regarding the genotype-phenotype relationship with previous published literature.
In summary, we used array CGH to map abnormalities in 94 patients with 5p deletions to improve understanding of genotype-phenotype relationships. The authors showed that there are three regions of the chromosome that differentially influence MR levels in patients. Deletions involving all or part of these three regions, in combination with other abnormalities in the genome, interact to produce the complete MR phenotype. Finally, the authors’ high-resolution data allowed for the elaboration of the location of genes involved in typical crying, facial features, and language delay in catless syndrome.
Table 2
Classification of MR
| MR level | Description(IQ) | phenotype | |
|---|---|---|---|
| Children | Toddler | ||
| 0 | Normal | No MR | No MR |
| 1 | Boundary (<70) | Students in standard schools for many years and need minor/major support | Normal developmental milestones, mild delays evident in the first school year |
| 2 | Very calm (<65) | Has attended standard school for several years, requires significant support, and has simple reading, writing, and mathematics skills. | Normal developmental milestones in the first few years, mild delay evident from age 2-3 |
| 3 | Calm (<50) | Understands everything, even long texts, and has very simple reading, writing, and arithmetic abilities. | Developmental milestones are delayed for several months. |
| 4 | Moderate (<35) | Understands most things and uses small sentences and lots of signs. | Developmental milestones are delayed by several months. Obvious delay from 1 year of age |
| 5 | Severe (<20) | Understand simple everyday sentences and vocabulary, use 2-3 word sentences and many signs, and walk. | Developmental milestones are delayed by several months to a year. MR becomes apparent before 1 year of age |
| 6 | Very serious (<10) | I can understand some words. Usually walks unsteadily if supported. There are no words or only a few words. | Developmental milestones delayed by several years; MR becomes apparent before 6 months |
| 7 | Profound | Mind or unresponsive and can sit or stand. | Even at the age of 5, he cannot sit by himself. |
Can slide horizontally
Table 3
Array clone for 5p analysis
| Number of clones | Marker | Position | Clone name | |||
|---|---|---|---|---|---|---|
| Symbol | Name | Cytogeneticsa | Array(Mb)a | Genetic (cM)b | ||
| 1 | D5S1981 | AFMa217zh1 | 5p15.33 | 1.207 | 1 | CTC-326E20 |
| 2 | D5S2005 | AFMB002xc1 | 5p15.33 | 1.395 | 0 | RP11-94J21 |
| 3 | D5S1970 | AFMa183wh5 | 5p15.33 | 2.497 | 5 | CTB-116F8 |
| 4 | D5S417 | AFM205wh8 | 5p15.33 | 3.174 | 6 | RP11-20B3 |
| 5 | D5S1980 | AFMA217yh1 | 5p15.33 | 3.449 | 7 | RP11-82M24 |
| 6 | D5S675 | AFM336tc1 | 5p15.33 | 3.998 | 9 | RP11-103L11 |
| 7 | D5S1906 | WI-2725 | 5p15.33 | 4.258 | CTB-27O23 | |
| 8 | D5S405 | AFM154xa3 | 5p15.33 | 3.995 | 9 | RP11-227M19 |
| 9 | D5S406 | AFM154xg3 | 5p15.32 | 5.047 | 12 | RP11-58A5 |
| 10 | D5S1921 | WI-2897 | 5p15.32 | 5.200 | CTC-263B18 | |
| 11 | D5S464 | AFM112xe3 | 5p15.32 | 5.890 | 15 | CTC-248O4 |
| 12 | D5S2054 | AFMB355wb1 | 5p15.32 | 5.945 | RP11-53K22 | |
| 13 | D5S635 | AFM276yb9 | 5p15.32/15.31 | 6.365 | 16 | RP11-36H5 |
| 14 | D5S676 | AFM347yg9 | 5p15.31 | 7.492 | 18 | RP11-46O23 |
| 15 | D5S18c | 5p15.31 | 8.021 | CTB-16G3 | ||
| 16 | D5S1957 | AFMa124wg5 | 5p15.31 | 8.550 | 20 | CTB-27I9 |
| 17 | D5S208 | 5p15.31 | 9.039 | 21 | DPA-896A3 | |
| 18 | D5S74d | 5p15.31 | 9.288 | DPA-671G7 | ||
| 19 | D5S630 | AFM268zd9 | 5p15.31 | 9.614 | 21 | DPA-255H3 |
| 20 | D5S759 | AFM204ze1 | 5p15.31/15.2 | 10.100 | DPA-1398C5 | |
| 21 | D5S1850 | WI6722 | 5p15.2 | 10.328 | DPA-1104F2 | |
| 22 | D5S23e | 5p15.2 | 10.364 | DPA-1349G2 | ||
| 23 | AFM042xa11 | 5p15.2 | 10.403 | 23 | RP11-145B1 | |
| 24 | D5S2480 | WI7320 | 5p15.2 | 10.732 | DPA-941C2 | |
| 25 | D5S432 | AFM255xb9 | 5p15.2 | 10.746 | RP11-72C10 | |
| 26 | D5S117 | 5p15.2 | 11.360 | DPB-70G7 | ||
| 27 | D5S2887 | AFMa240xf9 | 5p15.2 | 11.435 | 25 | RP11-29N3 |
| 28 | D5S478 f | AFM179xd10 | 5p15.2 | 11.035 | 24 | CTC-305H11 |
| 29 | D5S2081 | AFM347ta5 | 5p15.2 | 13.530 | 26 | CTC-305H17 |
| 30 | D5S1991 | AFMa282wa5 | 5p15.2/15.1 | 14.929 | 29 | RP11-5N8 |
| 31 | D5S1989 | AFMa247wc1 | 5p15.1 | 15.679 | 30 | RP11-135M13 |
| 32 | D5S1954 | AFMA114xf9 | 5p15.1 | 15.872 | 30 | RP11-261B20 |
| 33 | D5S1963 | AFMA140vd1 | 5p15.1 | 16.684 | 31 | RP11-269O14 |
| 34 | D5S416 | AFM205wh10 | 5p15.1 | 16.723 | 31 | RP11-260E18 |
| 35 | D5S2114 | AFMa090yh5 | 5p15.1 | 16.949 | 32 | CTB-28D11 |
| 36 | D5S486 | AFM206zc1 | 5p15.1 | 17.224 | 34 | CTB-33B3 |
| 37 | D5S2096 | AFM105xg1 | 5p15.1 | 17.500 | 35 | RP11-88L18 |
| 38 | WI-4804 | 5p15.1/14.3 | 18.336 | CTB-34B4 | ||
| 39 | D5S2419g | WI-10830 | 5p14.3 | 20.837 | CTC-253L1 | |
| 40 | D5S411 | AFM193xe11 | 5p14.3 | 21.797 | 39 | CTB-55P22 |
| 41 | D5S1868 | WI-9400 | 5p14.3/14.2 | 23.276 | CTB-115E13 | |
| 42 | D5S648 | AFM292yg5 | 5p14.1 | 25.841 | 42 | CTB-100A5 |
| 43 | D5S627 | AFM217ye1 | 5p14.1 | 26.794 | 43 | CTC-296N5 |
| 44 | D5S661/D5s2061 | AFMC011xb1 | 5p14/13 | 30.022 | 44 | CTB-161H9 |
| 45 | D5S477f | AFM177xb4 | 5p13.3 | 31.942 | 49 | |
| 46 | D5S1993 | AFMa286ya9 | 5p13.3 | 31.751 | 48 | CTB-13O21 |
| 47 | D5S1986 | AFMA238za9 | 5p13.3 | 31.776 | 49 | RP11-5N11 |
| 48 | D5S1996 | AFM297wa5 | 5p13.3 | 32.162 | 51 | RP11-67P13 |
| 49 | D5S651 | AFM302wd5 | 5p13.3 | 33.428 | 51 | CTC-221E3 |
| 50 | D5S2062 | AFM277yh9 | 5p13.3 | 33.806 | 55 | RP11-94E6 |
| 51 | D5S395f | AFM284vc1 | 5p13.3 | 30.726 | CTB-62F24 | |
| 52 | D5S1506 | GATA63c02 | 5p13.3 | 33.873 | CTB-38G24 | |
| 53 | D5S395 | AFM063yb6 | 5p13.2 | 35.843 | 57 | RP11-85N3 |
| 54 | D5S2025 | AFMb297za5 | 5p13.2 | 36.018 | 57 | CTB-107L17 |
| 55 | D5S1994 | AFMa286ze9 | 5p13.2 | 36.465 | 56 | CTB-18O17 |
Can slide horizontally
- Note -An electronic version of this table (Table A2) is included in Appendix A (online version only).
- a Locations are based on July 2003 UCSC sequence.
- b Locations are based on an STS-based map of the human genome (Hudson et al. 1995).
- c Interpolation between D5S676 and D5S1957.
- d Interpolation between D5S208 and D5S630.
- e Interpolation between D5S1850 and afm042xa11.
- f Position is based on order by deleted data. This order does not match the genome sequence.
- g Our data show that this sequence is duplicated within the genome. No overlap was found in the July 2003 freeze. The April 2003 freeze showed that the second copy was at 34.070Mb.
Table 4 Additional abnormalities
| Patient | MR Level | Cytogenetic location | Number of copies | upper limit | Lower limit | Size (Mb) | Revised karyotypea | ||
|---|---|---|---|---|---|---|---|---|---|
| Keep Cloneb | Position (Mb)c | Keep Cloneb | Position (Mb)c | ||||||
| 16 | 6.5 | 8pter-21.3 | 3 | pter | 0 | RP11-89M8 | 22.745 | 22.745 | 46,XX,der(5)t(5;8)(p14.1;p21) |
| 24 | 7 | 13q32.2-ter | 3 | RP11-40H10 | 93.26 | qter | 113.042 | 19.782 | 46,XX,der(5)t(5;13)(p14.1;q32.2) |
| 25 | 7 | 5q35.3-ter | 3 | RP11-125L2 | 173.496 | qter | 181.034 | 7.538 | 46,XX,der(5)t(5;5)(p14.2;q35.3)mat |
| 35 | 6.5 | 14q11.2 | 1 | RP11-152G22 | 19.227 | RP11-68M15 | 21.467 | 2.24 | 45,XY,der(5)t(5;14)(p14.2;q11.2), -14,mat |
| 45 | 7 | 6q25.2-6qter | 1 | GS-59B4 | 152.455 | RP1-57H24 | 170.695 | 18.24 | 46,XY,der(14)t(5;14)(q11;p13) del(5)(p15.1p15.2)del(6)(q25.2) |
| 48 | 6.5 | 5p15.11-5p14 | 3 | RP11-261B20/32d | 15.872 | CTC-296N5/43 | 26.794 | 10.922 | 46,XY,del(5)(p14.3)dup(5)(p14.2p15.1) |
| 104 | 6.5 | 5p13.3 | 4 | CTB-13O21/46 | 31.715 | RP11-67P13/48 | 32.162 | .447 | 46,XY,del(5)(p13.3)dup(5)(~p13.3)e×2 |
| 201 | 7 | 5q35.1-terf | 3 | RP11-15F10 | 169.122 | qter | 181.034 | 11.912 | 46,XY,der(5)t(5;5)(p14.3q35.1) |
| 206 | 7 | 20pter-12.2 | 3 | pter | 0 | DuPontA-967A8 | 10.282 | 10.282 | 46,XX,der(5)t(5;20)(p14.3;p12.2)pat |
| 210 | 7 | 1qter | 3 | RP11-194F13 | 238.741 | qter | 246.127 | 7.386 | 46,XX,der(5)t(1;5)(q43;p14.1)pat |
| 215 | 7 | 4q31.1-ter | 3 | RP11-40D5 | 135.249 | qter | 191.731 | 56.482 | 46,XX,der(5)t(4;5)( q31.1;p14.3) |
| 218 | 6.5 | 8pter-8p23.2 | 3 | pter | 0 | RP11-112O08 | 11 | 11 | 46,XX,der(5)t(5;8)(p14.3;p23.2)pat |
| 228 | 6 | 8q23.1-ter | 3 | CTD-2013D21 | 110.377 | qter | 146.308 | 35.931 | 46,XY,der(5)t(5;8)(p15.2;q23.1)pat |
| 251 | 6.5 | 5p13.3 | 3 | CTB-115E13/41 | 23.276 | RP11-94E6/50 | 33.806 | 10.53 | 46,XY,del(5)(p13.3)dup(5)(p13.3~14.1)e |
| 255 | 6.5 | 1qter | 3 | RP11-210E16g | 229.578 | 46,XY,der(5)t(1;5)(q42~43;15.2) | |||
Can slide horizontally
- Note: Abnormalities that appear to extend to telomeres are designated as pter or qter.
- a Karyotype is revised based on sequence data. The initial evaluation is shown in Table 1.
- b A clone at the upper (closest to pter) or lower (closest to qter) boundary of the aberration, but not included in the aberration.
- c Position is based on the July 2003 UCSC sequence and estimates the position of the decimal point.
- d Clone numbers in Table 3.
- e Define with array data.
- f There is noisy data due to poor DNA quality. Other abnormalities may also be present.
- g gain includes this clone. There were insufficient clones on the array to estimate the size of the resulting region.
Figure 2
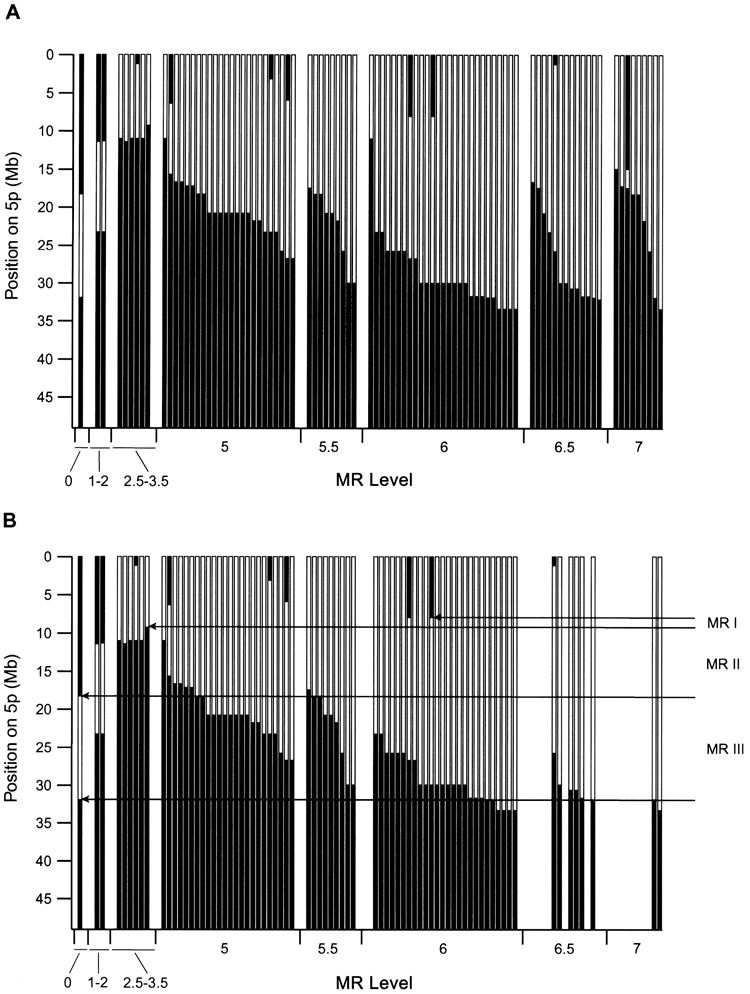
Dependence of MR levels on 5p deletion. A, Data for all 91 patients for whom delayed evaluation was available. The black area indicates the chromosomal region retained in each case, plotted against the physical position from the 5pter. The centromere is just below the bottom of the graph. The dependence of the level of delay on deletion is clear, but the general trend often involves deletions that appear too small. For MR level 5, data is plotted in order of proximal deletion boundaries within each level.
There is an estimated uncertainty of 0.5 to 1 in the assignment of MR levels for the delayed phenotype from these severely and severely affected patients. B, the same plot was used for patients in which only the 5p deletion was detected. Note that most patients with severe disabilities no longer exist due to further abnormalities. The dependence of delay on 5p deletion is much more consistent. It is suggested that three regions, 5p-MRI, MRII, and MRIII, have differential effects on delay. These areas are explained in the main text.
Figure 3 Am. J. Hum. Genet. 76:312–326, 2005
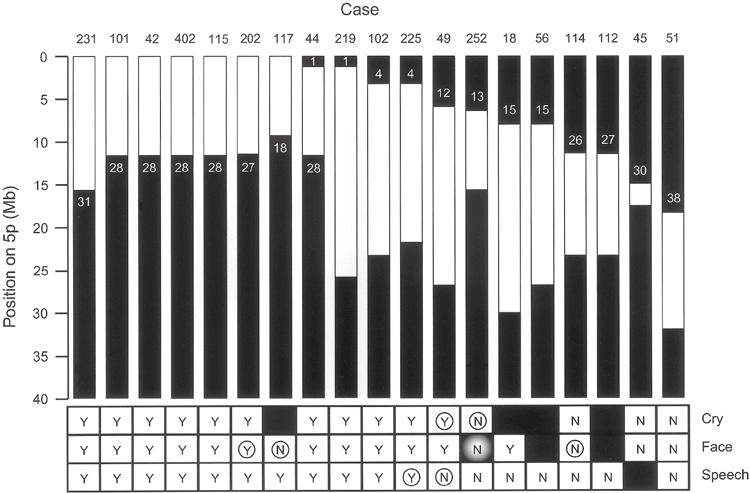 Summary of patient data identifying regions of 5p involved in phenotypic crying, facial dysmorphia, and language delay characteristics. Black areas indicate chromosomal retention regions. Shows the clones remaining at the border (see Table 3). “Y” indicates that the phenotypic feature is present in the patient and “N” indicates that it is absent.
A black square indicates that information related to that patient was not available. Circles indicate patients that provide the most useful information regarding the location of the chromosomal portion responsible for that feature. The shaded “N” for patient 252 indicates that this patient’s deletion would have otherwise produced the phenotype.
Figure 4 Zhang et al.: Cri du Chat Genotype-Phenotype
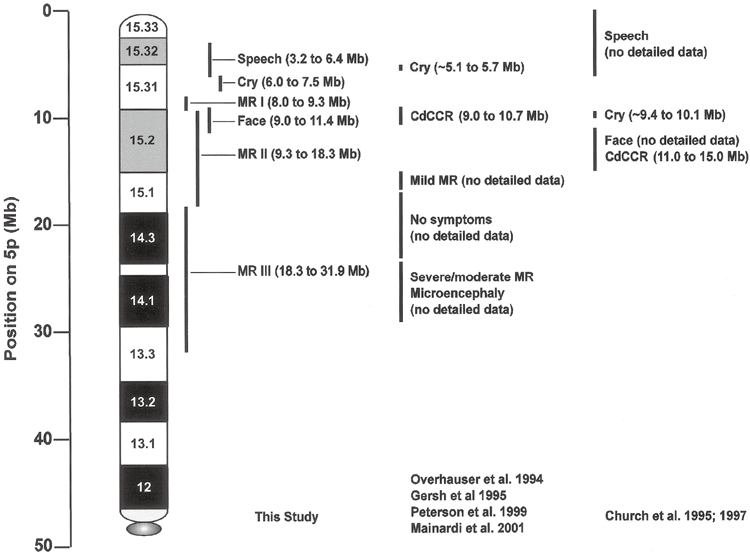 Summary of genotype-phenotype relationships from the authors’ data and data from previous literature. Chromosomal bands are shown relative to the physical map obtained from the July 2003 human genome sequence freeze.
Acknowledgments
This research was supported by Grant HD 17665 from the U.S. National Institute of Child Health and Human Development, Visys Co., Ltd., the Danish STF Comparative Genomics Program, the Integrative Biology Platform of the Danish Fund for Basic Research, and the National Natural Science Foundation of China. received.
Electronic database information
- The URL of the data posted here is as follows. Online Mendelian Inheritance (OMIM), http://www.ncbi.nlm.nih.gov/Omim/(for catless syndrome), UCSC Genome Bioinformatics, http://genome.cse.ucsc.edu/References Albertson DG, Pinkel D (2003) Genomic microarrays in human genetic disease and cancer.
References
- Hum Mol Genet 12(Spec 2):R145-152 Albertson DG, Ylstra B, Segraves R, Collins C, Darkee SH, Kowbel D, Kuo WL, Gray JW, Pinkel D (2000) Amplicon structure by array CGH. Quantitative mapping of CYP24 was confirmed as a candidate oncogene.
- Nat Genet 25:144-146 Church DM, Bengtsson U, Nielsen KV, Wasmuth JJ, Niebuhr E (1995) Molecular definition of different segmental deletions of distal 5p resulting in distinct phenotypic features.
- Am J Hum Genet 56:1162-1172 Church DM, Yang J, Bocian M, Shiang R, Wasmuth JJ (1997) High-resolution physical and transcriptional map of the catless region of human chromosome 5p.
- Genome Res 7:787-801 Eichler EE (2001) Recent duplications, domain additions, and dynamic mutations of the human genome.
- Trends Genet 17: 661-669 Fiegler H, Carr P, Douglas EJ, Burford DC, Hunt S, Scott CE, Smith J, Vetrie D, Gorman P, Tomlinson IP, Carter NP(2003) Using DNA microarrays. , performed comparative genomic hybridization based on DOP-PCR amplification of BAC and PAC clones.
- Genes Chromosomes Cancer 36:361-374 Gersh M, Goodart SA, Pasztor LM, Harris DJ, Weiss L, Overhauser J (1995) Evidence for distinct regions that cause cat-like calls in patients with 5p deletions.
- Am J Hum Genet 56: 1404-1410 Gersh M, Grady D, Rojas K, Lovett M, Moyzis R, Overhauser J (1997) Development of a diagnostic tool for the analysis of 5p deletions using interphase FISH.
- Cytogenet Cell Genet 77: 246-251 Hand JL, Michels VV, Marinello MJ, Ketterling RP, Jalal SM (2000) Interstitial deletions of chromosomes 5p and 16q are inherited without obvious phenotypic effects: furth confirmation.
- Prenat Diagn 20:144-148 Hudson TJ, Stein LD, Gerety SS, Ma J, Castle AB, Silva J, Silva J, Slonim DK, Baptista R, Kruglyak L, Xu S-H, Hu X, Colbert AME, Rosenberg C, Reeve-Daly, MP, Rozen, S, Hui, L, Wu, X, Vestergaard, C, Wilson, KM, Bae, JS, Maitra, S, Ganiatsas, S, Evans, CA, DeAngelis, MM, Ingals, KA (1995).ス地図。 li>
- Science 270:1945-1954 Iafrate AJ, Feuk L, Rivera MN, Listewnik ML, Donahoe PK, Qi Y, Scherer SW, Lee C (2004).
- Nat Genet 36:949-951 Jain AN, Tokuyasu TA, Snijders AM, Segraves R, Albertson DG, Pinkel D (2002) Fully automated quantification of microarray image data
- Genome Res 12:325-332 Johnson EI, Marinescu RC, Punnett HH, Tenenholz B, Overhauser J (2000) 5p14 deletion is associated with microcephaly and seizures.
- J Med Genet 37:125-127 Kjaer I, Niebuhr E (1999) Skull base studies in 23 patients with cat-free syndrome suggest cranial developmental sites involved in this condition.
- Am J Med Genet 82:6-14 Levy B, Dunn TM, Kern JH, Hirschhorn K, Kardon NB (2002) Molecular cytogenetic analysis of dup5q phenotype in dup5q/del 5p (cri du chat) patients. Delineation
- Am J Med Genet 108:192-197 Lupski JR, Roth JR, Weinstock GM (1996) Chromosome duplication in bacteria, Drosophila, and humans.
- Am J Hum Genet 58:21-27 Mainardi PC, Perfumo C, Cali A, Coucourde G, Pastore G, Cavani S, Zara F, Overhauser J, Pierluigi M, Bricarelli FD (2001) 80 patients with 5p deletion. Clinical and molecular features: genotype-phenotype correlation
- J Med Genet 38:151-158 Marinescu RC, Johnson EI, Dykens EM, Hodapp RM, Overhauser J (1999a) No relationship between deletion size and level of developmental delay in cat-less syndrome.
- Am J Med Genet 86:66-70 Marinescu RC, Johnson EI, Grady D, Chen XN, Overhauser J (1999b) FISH analysis of terminal deletions in patients diagnosed with no-cat syndrome
- Clin Genet 56:282-288 Niebuhr E (1978a) Cytological observation of 35 cases with 5p-karyotype.
- Hum Genet 42:143-156 —(1978b) Catless syndrome: epidemiology, cytogenetics, and clinical features.
- Hum Genet 44:227-275 Overhauser J, Huang X, Gersh M, Wilson W, McMahon J, Bengtsson U, Rojas K, Meyer M, Wasmuth JJ (1994) Molecular and phenotypic mapping of the short arm of chromosome 5. : Sublocalization of the critical region of the no-cat syndrome.
- Hum Mol Genet 3:247-252 Overhauser J, McMahon J, Oberlender S, Carlin ME, Niebuhr E, Wasmuth JJ, Lee-Chen J (1990) Parental origin of chromosome 5 deletion in catless syndrome.
- Am J Med Genet 37:83-86 Peterson ET, Sutherland R, Robinson DL, Chasteen L, Gersh M, Overhauser J, Deaven LL, Moyzis RK, Grady DL (1999) Integrated physics of the short arm of human chromosome 5. map.
- Genome Res 9:1250-1267 Pinkel D, Segraves R, Sudar D, Clark S, Poole I, Kowbel D, Collins C, Kuo WL, Chen C, Zhai Y, Dirkee SH, Ljung BM, Gray JW, Albertson DG (1998) High-resolution analysis of DNA copy number variation using comparative genomic hybridization on microarrays
- Nat Genet 20:207-211 Pollack JR, Perou CM, Alizadeh AA, Eisen MB, Pergamenschikov A, Williams CF, Jeffrey SS, Bo stein D, Brown PO (1999) Measuring DNA copy number changes using cDNA microarrays. Genome-wide analysis
- Nat Genet 23:41-46 Sebat J, Lakshmi B, Troge J, Alexander J, Young J, Lundin P, Maner S, Massa H, Walker M, Chi M, Navin N, Lucito R, Healy J, Hicks J, Ye K, Reiner A, Gilliam TC, Trask B, Patterson N, Zetterberg A, Wigler M (2004) Large-scale copy number variations in the human genome.
- Science 305:525-528 Snijders AM, Nowak N, Segraves R, Blackwood S, Brown N, Conroy J, Hamilton G, Hindle AK, Huey B, Kimura K, Law S, Myambo K, Palmer J, Ylstra B , Yue JP, Gray JW, Jain AN, Pinkel D, Albertson DG (2001) Assembly of microarrays for genome-wide DNA copy number measurements
- Nat Genet 29:263-264 Solinas-Toldo S, Lampel S, Stilgenbauer S, Nickolenko J, Benner A, Dohner H, Cremer T, Lichter P (1997) Matrix-based comparative genomic hybridization: eliminating genomic imbalance. Biochip for screening.
- Genes Chromosomes Cancer 20:399-407 Sreekantaiah C, Kronn D, Marinescu RC, Goldin B, Overhauser J (1999) Patients with typical cat-like crying and no other clinical signs of no-cat syndrome. Characterization of complex chromosomal rearrangements in.
- Am J Med Genet 86:264-268 Wilkins LE, Brown JA, Nance WE, Wolf B (1983) Clinical heterogeneity in 80 home-reared children with absent cat syndrome
- J Pediatr 102:528-533
Publisher’s Note
Springer Nature remains neutral with regard to jurisdictional claims in published maps and institutional affiliations.
日本皮膚科学会 皮膚科専門医/日本医師会 産業医/東京衛生検査所 指導監督医
この記事は、 ヒロクリニックNIPTの編集・監修体制 にもとづき、資格を持つ医師が内容を確認しています。